Fuccura Studio original · Free · MIT
Contributions
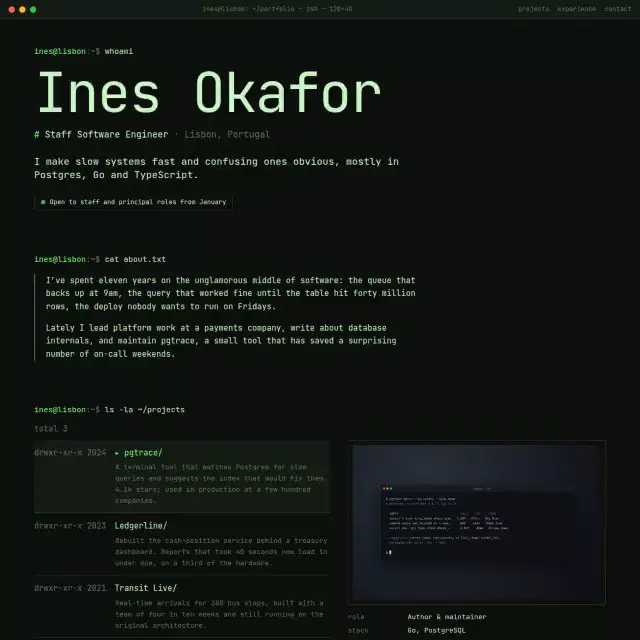
A contribution graph made from your actual years of work, with repositories pinned like a profile done properly.
Designed by Fuccura Studio
Added 2 October 2026 · 0 downloads

The idea
A contribution graph made from your actual years of work, with repositories pinned like a profile done properly.
Inspired by
Developer profile pages and contribution graphs, redrawn from real years of work.
What to notice
Each square in the graph is a year of the owner’s career, not a day of commits.
How it was made
Drawn and built by the Fuccura studio as a React component, then tested in the editor, on phones and with reduced motion. Every section reads from one shared content model, so the same words fill any design.
Who it’s for
Open-source developers, Full-stack developers, New graduates.
Scroll through it
The real template, running live with sample content.
Two ways to use it
Free · you edit the code
Download and set it up
- Install Node.js (the LTS version) if you don’t have it.
- Unzip the download and open the folder in a terminal.
- Run
npm install, thennpm run dev. It opens in your browser. - Put your own words in
src/content.jsonand your photos inpublic/. Colours and fonts are in the README. - Run
npm run buildand upload thedistfolder to any static host (Netlify, Cloudflare Pages, GitHub Pages).
No code · free to start
Let Fuccura handle it
- Click any text or photo to change it, no code at all
- A free address, or your own domain with Pro
- Hosting, speed and security looked after
- A blog, and the Investigator to keep it up to date
- Switch to another design any time, keeping your words